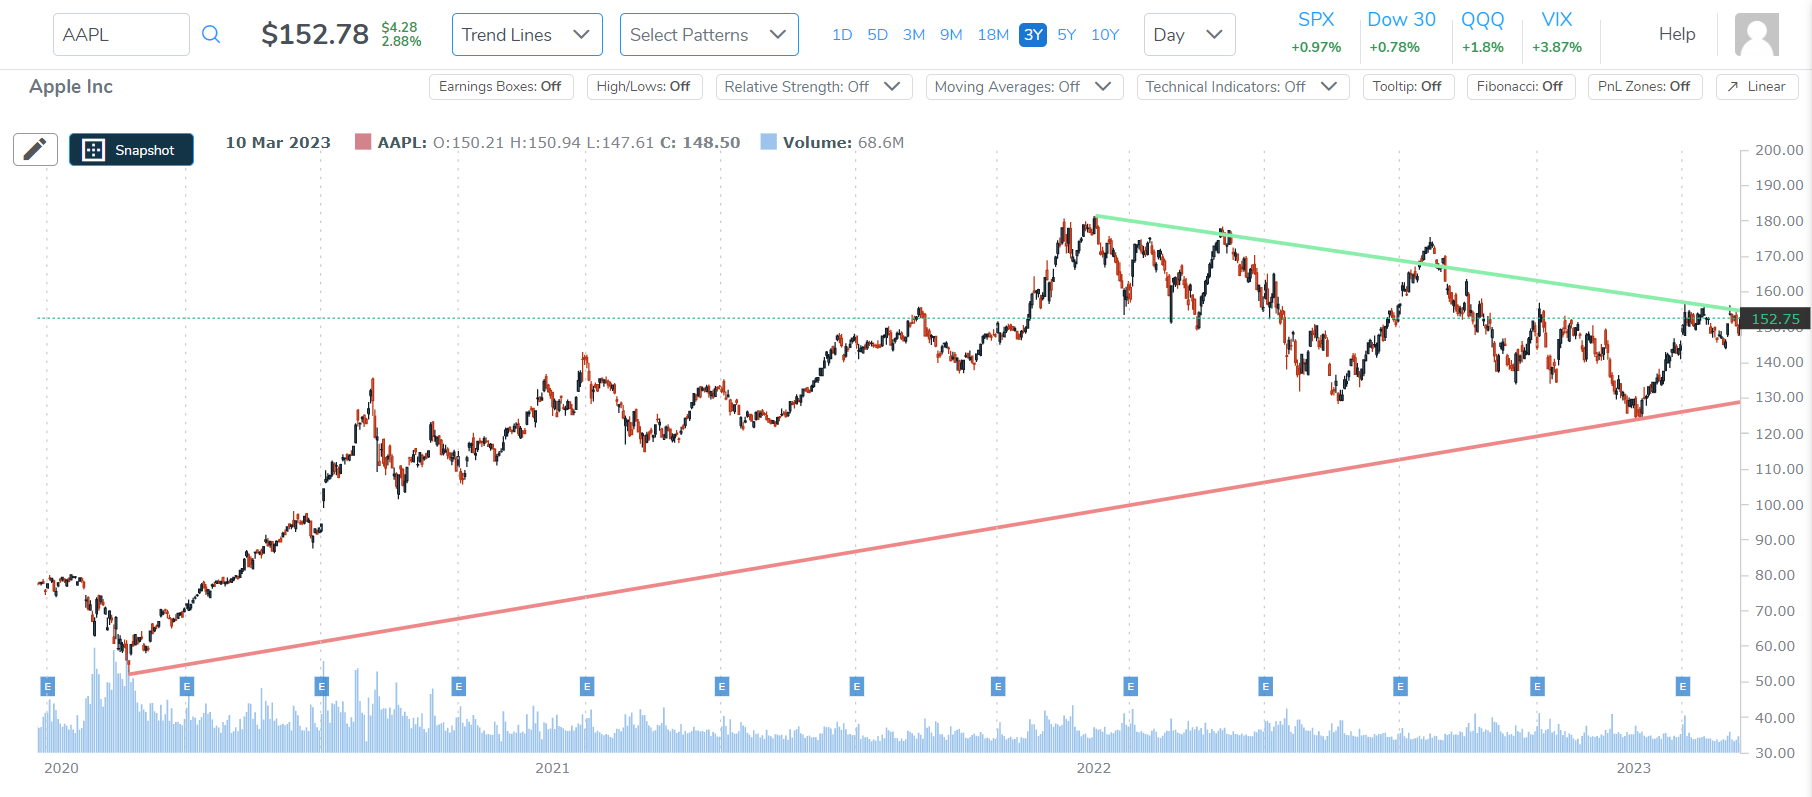
The "Trend Lines" button allows members to enable/disable trend lines. You can find this option in the upper right above the chart:

When trend lines are turned on, you can view on the chart the algorithmically drawn trend lines on your stock chart:
Trend Lines (Support and Resistance):

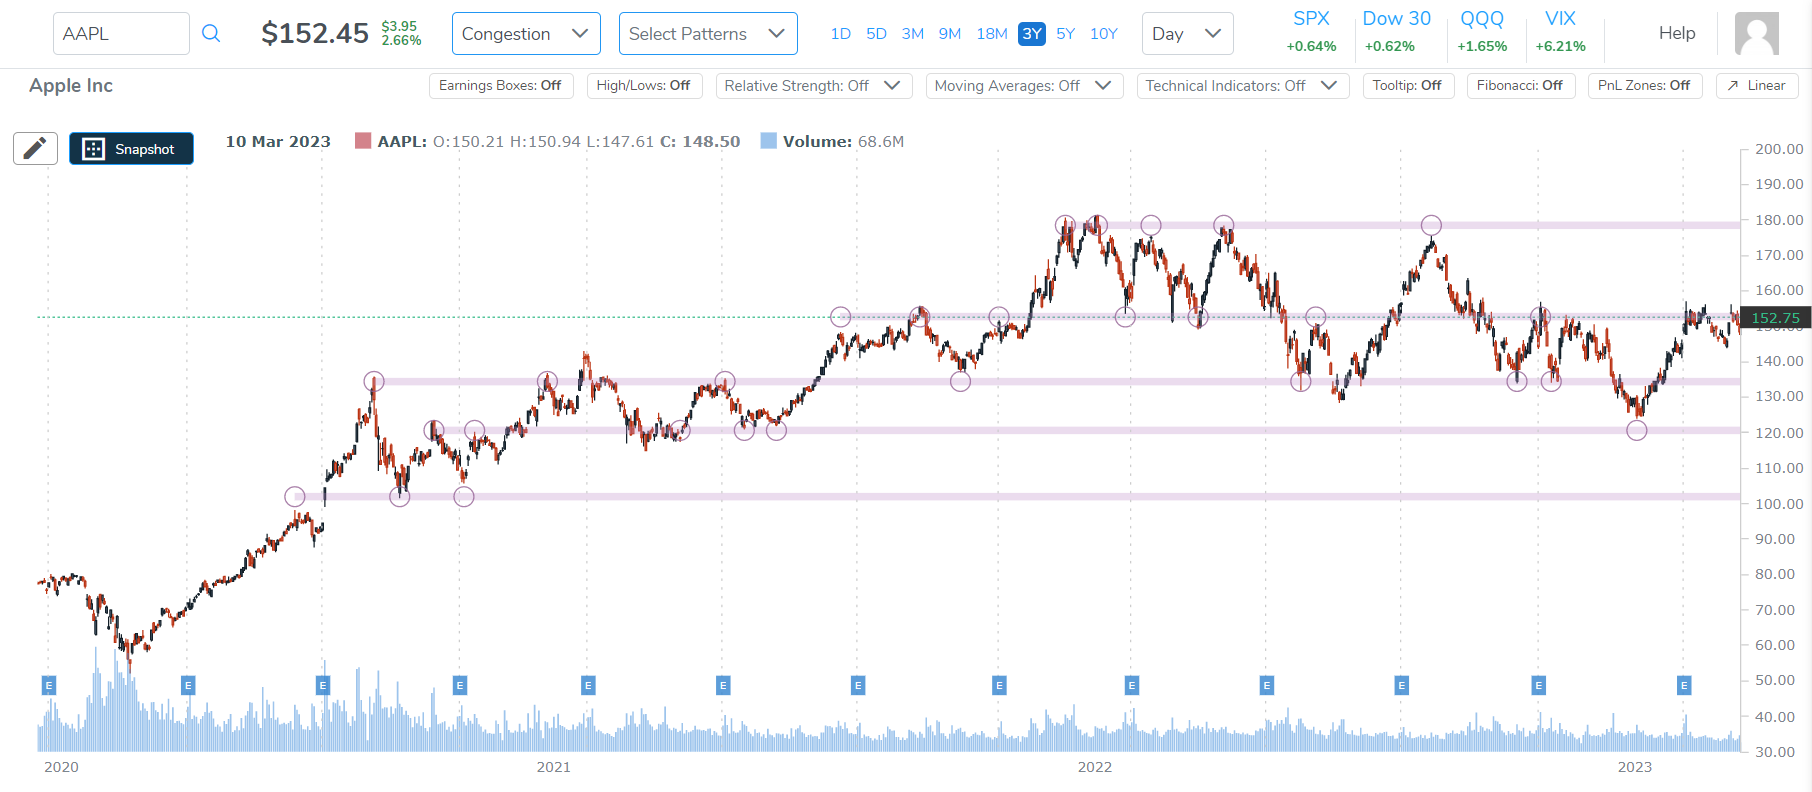
Congestion:

How Trend Lines are computed:
First, Pattern Finder draws every possible trend line from every candle in the chart. Once every line has been drawn we use artificial intelligence to select and the display the strongest, most supported trend lines.
How are these useful?
Trend Lines are most commonly used to identify "support" and "resistance" trends in the stock price. You can read more about that in our Education section here: What are Support and Resistance?
You can read more about Congestion lines here: Local Tops and Bottoms
What if I want to adjust these lines?
Computers are not always smarter than humans. Traders usually have personal preferences on how they choose to draw trendlines on a chart, so, our Artificial Intelligence won't always fit your needs.
If you find this is the case, you can manually adjust your trend lines by clicking the line you would like to adjust.
Once you click the line two yellow boxes will appear:

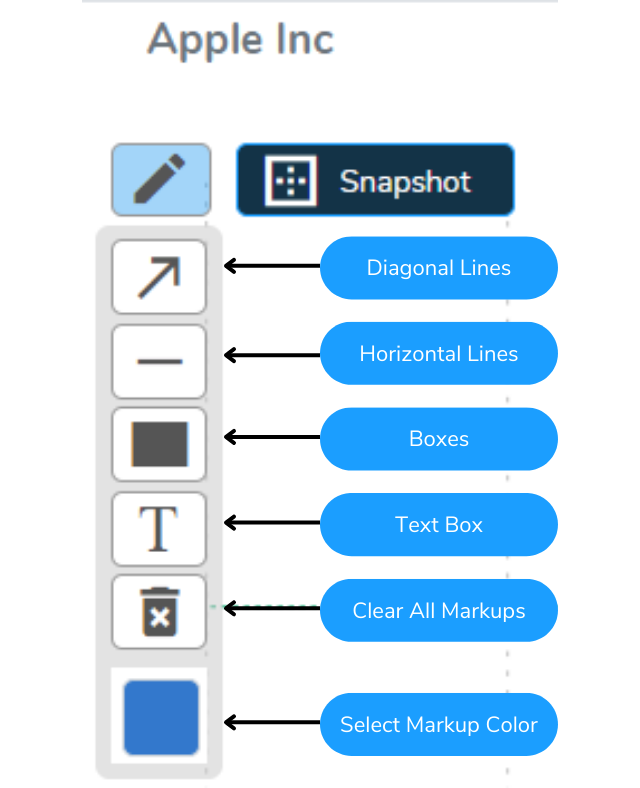
You can use these boxes to adjust the length and angle of your trendlines. Additionally, you can use the provided drawing tools to draw your own trendlines and more:
