Upon signing into your Pattern Finder account, you'll find a variety of options in the right hand menu:

In this article, you can read what data is included under each tab.
Watchlist:
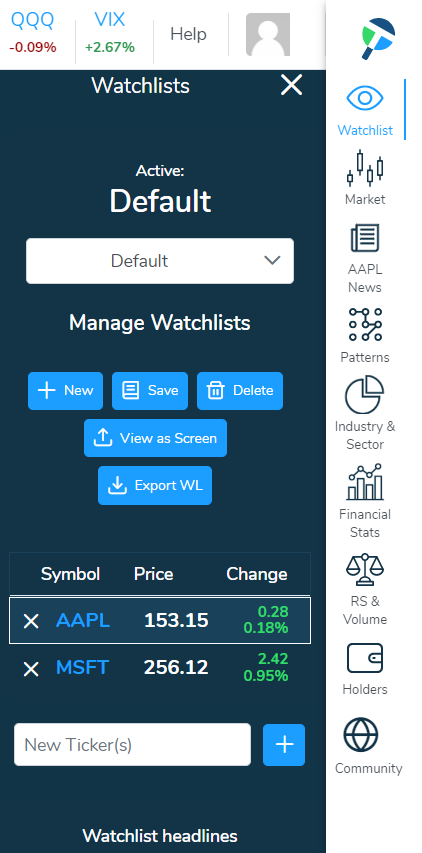
The "Watchlist" tab is where you can save your personal watchlist of stocks you are interested in monitoring.
To save a stock to your list, simply type the ticker and hit enter on your keyboard.
You can add multiple stocks at once by entering your tickers in a list separated by commas.
You can export your Watchlist to a .csv file. The .csv file will contain the symbol, price, and change for all tickers on the downloaded Watchlist.
You can also select "View as Screen" to load the Watchlist in the Stock Screener.
Once a stock is saved to your list you can simply click the "Watchlist" tab to see the current price and day change for each stock and any headlines for the stocks in your Watchlist.
Market:
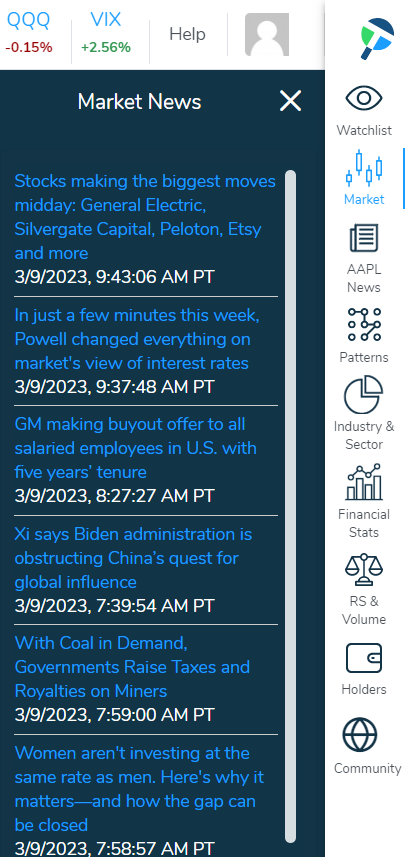
The "Market" tab will show you any breaking news that could affect the market.
Ticker News:
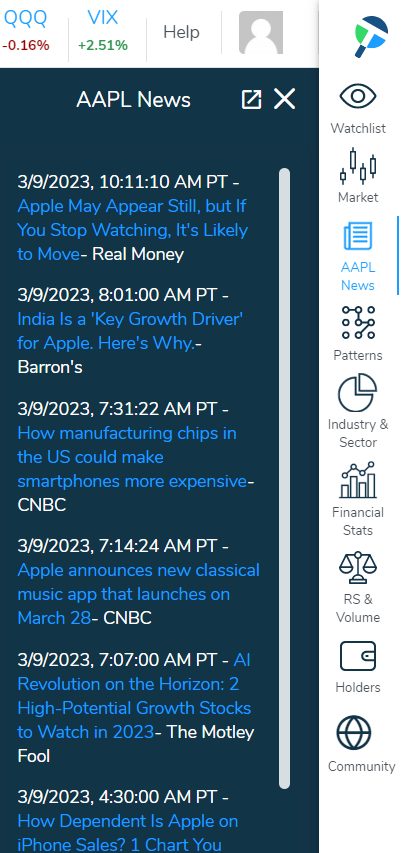
Under the "Ticker News" tab you can read all of the recent news for whichever stock you are currently analyzing a chart for.
Patterns
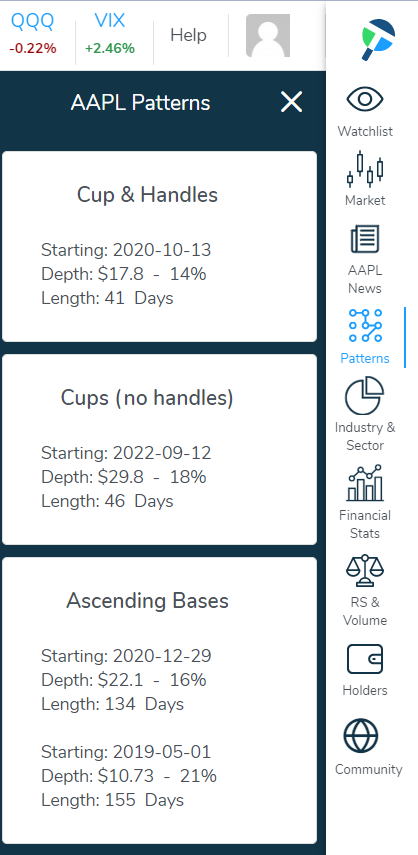
On the "Patterns" tab yiou can review the details for any CANSLIM pattern that is algorithmically detected on your current chart view.
Industry & Sector
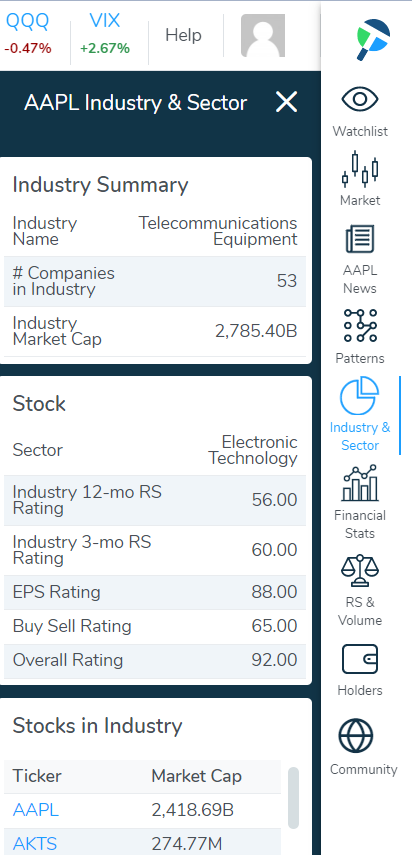
The "Industry & Sector" tab will show you what Industry the stock you are examining is in and how many companies are in that industry.
Here you can find an overview of the Industry Market Cap as well as the stock's sector, Industry Relative Strength (12 and 3 month), Earnings Per Share (EPS) Rating, Buy Sell Rating, Fundamental Rating, and Overall Rating.
You will also find a list of all of the stocks that are within the same industry with their respective Market Caps.
Financial Stats:
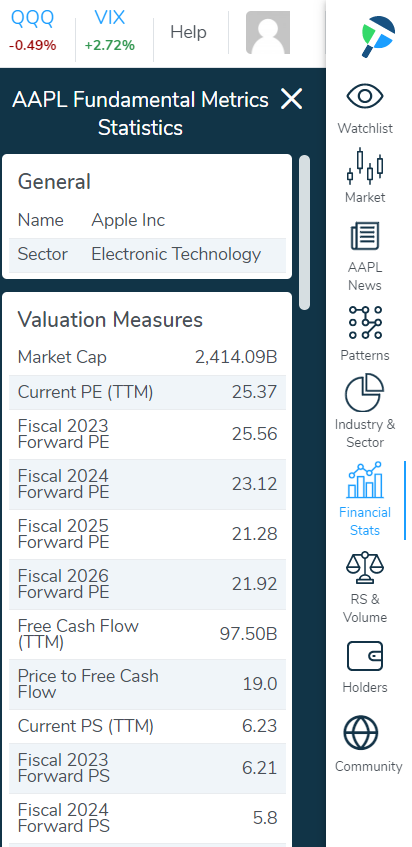
On the "Financial Stats" tab you can find various measures for the company you are examining.
On this tab you can see:
Company Name
Sector
Valuation Measures:
• Market Cap
• Current price/earnings ratio (PE) Trailing Twelve Month (TTM)
• Fiscal 2023 Forward PE
• Fiscal 2024 Forward PE
• Fiscal 2025 Forward PE
• Fiscal 2026 Forward PE
• Free Cash Flow (TTM)
• Price to Free Cash Flow
• Current PS (TTM)
• Fiscal 2023 Forward Price to Sales (PS)
• Fiscal 2024 Forward PS
• Fiscal 2025 Forward PS
• Fiscal 2026 Forward PS
• Consensus Analyst Price Target
• Price to Book
• Earnings Per Share (EPS) (Net Diluted)
Profitability Measures:
• Net Income Margin %
• Operating Margin %
• Free Cash Flow Margin %
• Gross Margin (TTM)
• Return on Assets (TTM)
• Return on Equity (TTM)
Income Statements:
• Revenue (TTM)
• Annual Revenue Growth (TTM)
• Implied Fiscal 2023 Forward (Fwd) Revenue Growth
• Implied Fiscal 2024 Fwd Revenue Growth
• Implied Fiscal 2025 Fwd Revenue Growth
• Implied Fiscal 2026 Fwd Revenue Growth
• Net Income (TTM)
• Gross Profit (TTM)
• EBITDA
Balance Sheet Highlights:
• Total Cash, Equivalents, Short-Term Investments
• Total Long-Term Investments
• Total Debt
• Current Ratio
• Book Value Per Share
Cashflow Statement Highlights:
• Cash from Operations (TTM)
Stock Price History Statistics:
• 1-Year Change
• 6-Month Change
• 3-Month Change
• Day Change
• 52 Week High
• 52 Week Low
Simple Moving Averages:
• 200-Day Moving Average
• 50-Day Moving Average
Exponential Moving Averages:
• 21-Day Moving Average
• 13-Day Moving Average
• 10-Day Moving Average
• 8-Day Moving Average
• 5-Day Moving Average
Share Statistics:
• Average Volume (1 month)
• Average Volume (10 day)
• Shares Outstanding
Relative Strength & Volume:
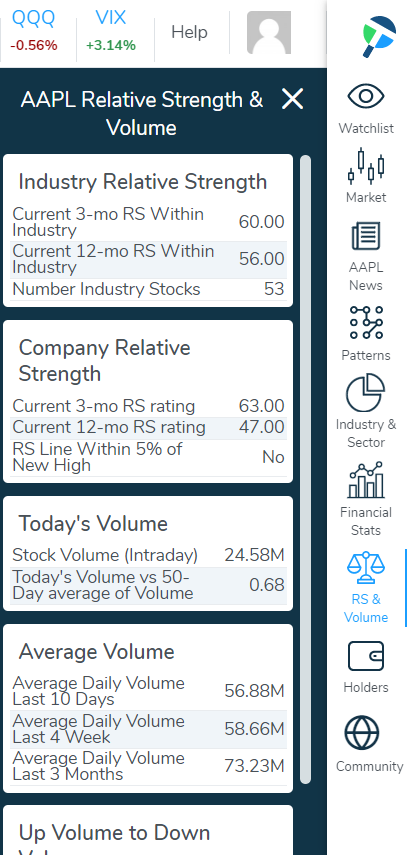
The "Relative Strength and Volume" tab will show you more details on relative strength (RS) and volume metrics, listed below.
Industry Relative Strength:
• Current 3-mo RS Within Industry
• Current 12-mo RS Within Industry
• Number Industry Stocks
Company Relative Strength:
• Current 3-mo RS rating
• Current 12-mo RS rating
• RS Line Within 5% of New High (Yes or No)
Today's Volume:
• Stock Volume (Intraday)
• Today's Volume vs 30-Day average of Volume
Average Volume:
• Average Daily Volume Last 10 Days
• Average Daily Volume Last 4 Week
• Average Daily Volume Last 3 Months
Up Volume to Down Volume:
• Up Volume to Down Volume Ratio 30-Days
• Up Volume to Down Volume Ratio 50-Days
Holders:
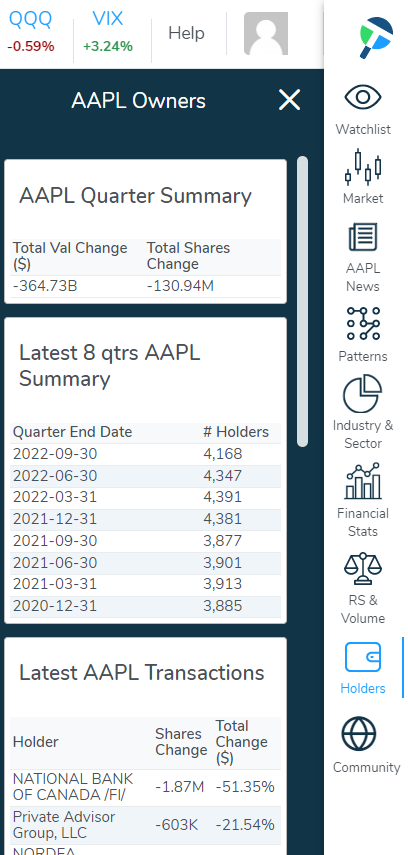
The "Holders" tab will show you the recent instiutional ownership statistics. This includes:
- Quarter Summary
- Latest 8 quarters Summary
- Latest Transactions
- Top Quarterly Transactions
- Top Owners
Community

Have instant access to other investors and information you can't find elsewhere!