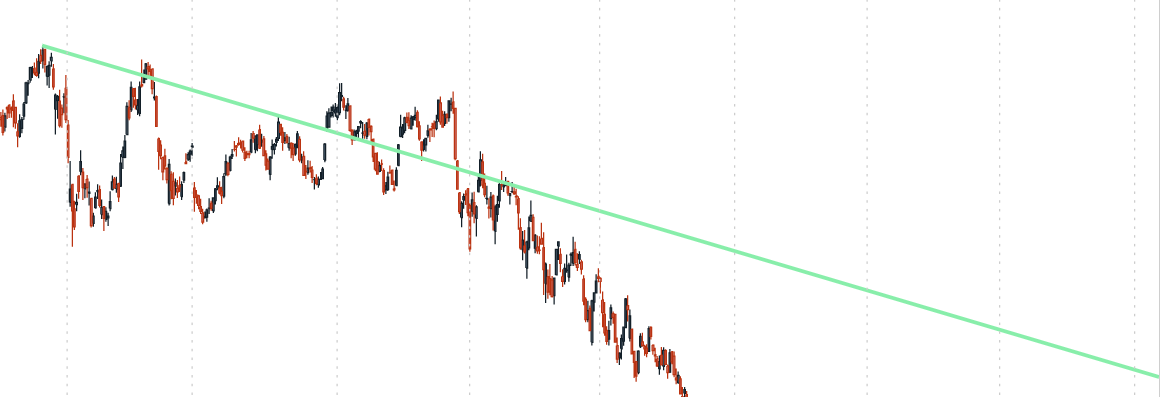
Support and resistance are key technical analysis concepts used to identify potential price levels at which a stock is likely to reverse its direction. These levels are based on the historical price action of the stock and are often depicted as horizontal lines on stock charts. They provide traders and investors with a visual representation of supply and demand dynamics in the market.
Support refers to a price level where the stock's downward movement is halted due to increased buying interest. As the price approaches the support level, buyers perceive the stock as undervalued, leading to increased demand and a potential price rebound. In essence, support acts as a "floor" for the stock price, indicating a level at which buyers are willing to step in and prevent further price declines.
Resistance, on the other hand, is the price level at which the stock's upward movement is impeded due to increased selling pressure. As the price approaches the resistance level, sellers perceive the stock as overvalued, causing them to sell and create downward pressure on the price. The resistance level, therefore, acts as a "ceiling" for the stock price, indicating a level at which sellers are likely to take profits and prevent further price appreciation.
Support and resistance levels are not fixed, and their significance may change over time as market conditions evolve. When a stock price breaks through a support or resistance level, it may become a new resistance or support level, respectively. This phenomenon is known as "role reversal."
Traders and investors use support and resistance levels to identify potential entry and exit points for their trades, set stop-loss orders, and gauge the overall market sentiment. By studying these levels, market participants aim to anticipate and capitalize on price reversals, minimize risk, and maximize profits.
In Pattern Finder, Resistance is represented by a green line when it is enabled on the chart.

In Pattern Finder, Support is represented by a red line when it is enabled on the chart.
