PnL zones, also known as profit and loss zones, refer to the nearest levels of congestion or trend support and resistance to the upside and downside for various time frames of any stock.
These can be seen as a level of profitability or loss that a trader or investor can experience based on the price movements of the stock with stops and limits set.
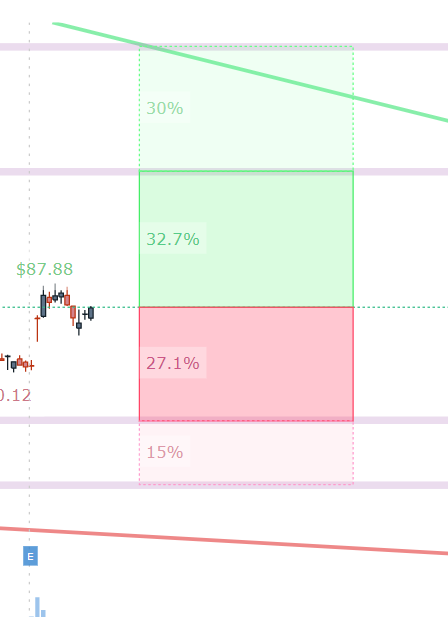
These zones are typically represented graphically on a chart, with different colors or shading used to indicate the distance, in stock percent change units, to the upside or downside of the nearest congestion or support and resistance lines, and then the distance to the second level upside and downside congestion points.
Here is how these are displayed in Pattern Finder:

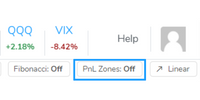
To enable PnL Zones, simply click the button at the top right of your chart labeled "PnL Zones".
