A commonly asked question from new members is: what are these numbers I see scattered across the chart and what are their significance?
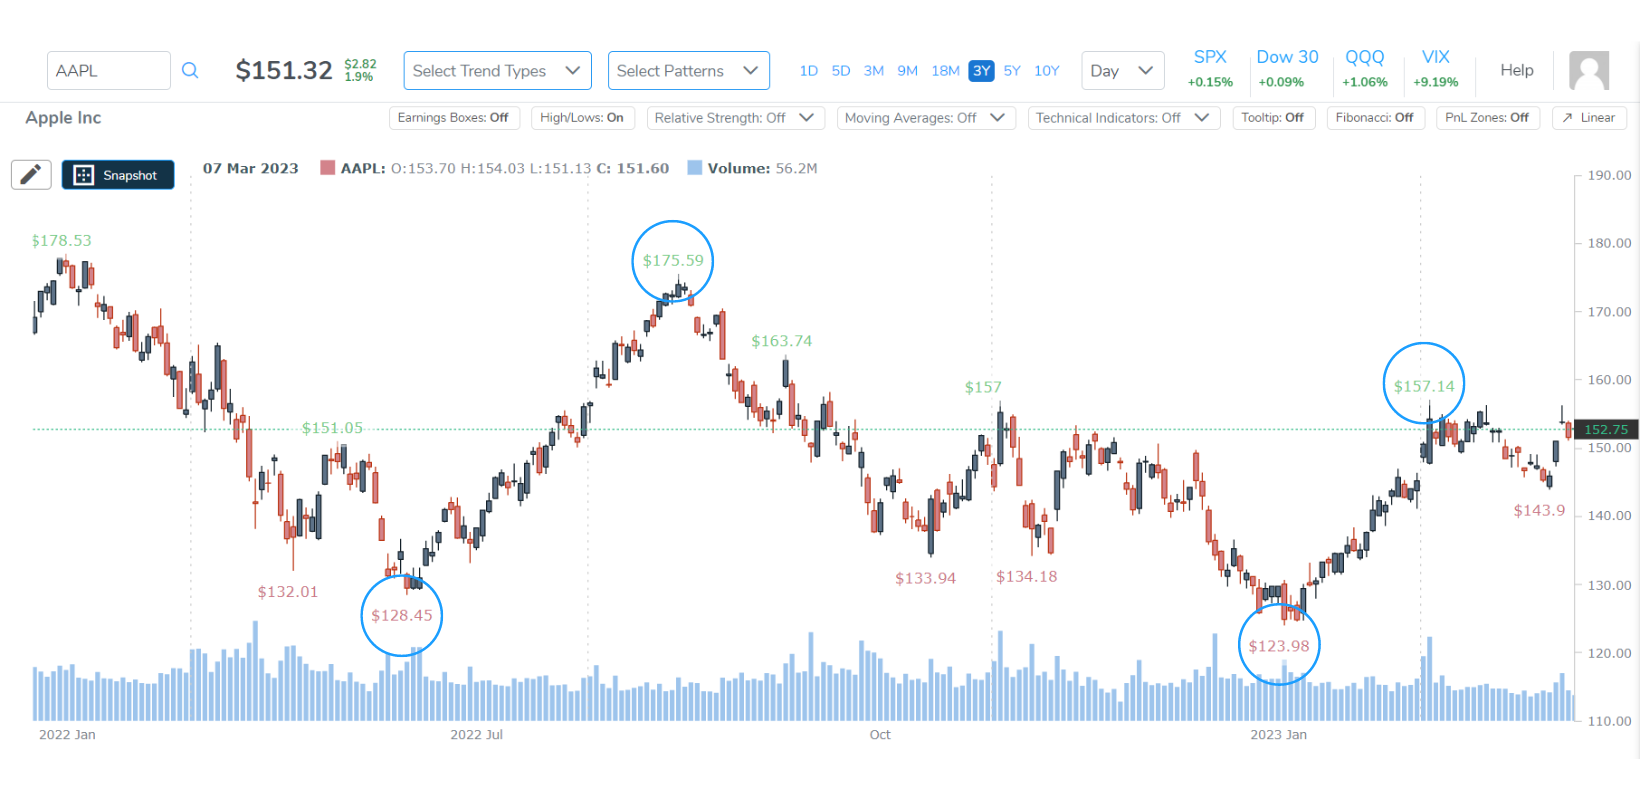
The prices you see on the chart are the relative highs and lows for the stock.
To view relative highs and lows, simply click the "High/Low" button at the top of your chart:
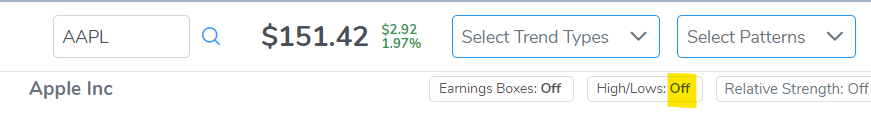
To hide this data, simply click the box again and it will switch to "off."