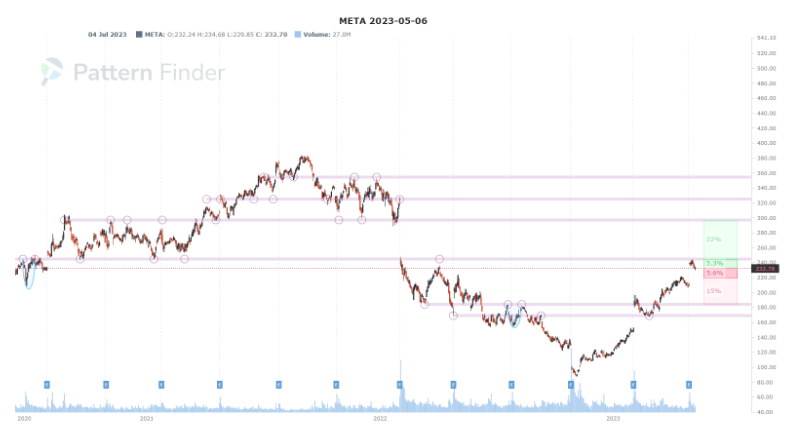
Congestion points are areas on a chart where the price of an asset has difficulty breaking through. They are demarcated in Pattern Finder as pink lines.
They are common areas of resistance and/or support, and they are significant because they signal potential changes in the direction of price movement.
Technical analysts use congestion points to identify potential trading opportunities and to help identify areas to set stop-loss orders.
Oftentimes, Pattern Finder will rely on congestion points as the drivers of profit and loss zones; demarcated as green and red shaded areas.
Here is a chart from May 6th, 2023 for Meta (META) from Pattern Finder. Note the congestion lines in pink and how they are formed by repeated occurrences of a price that acts either as support, resistance, or both.

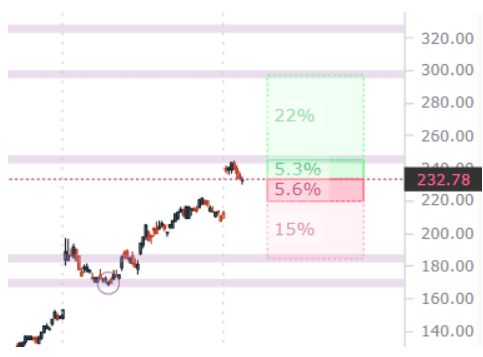
The note that the current price and the trading zones (or PnL zones) create a risk:reward scenario for a trader. We zoom in for clarity:

The green and red shaded zones are computed for users off of the congestion lines, and off of support and resistance lines (not shown in this image).
Before delving deeper into what congestion points are and how they are used, it is important to first understand the basic principles of technical analysis.
Technical analysts study the historical price movements of an asset to identify patterns and trends. They believe that the price of an asset is influenced by the psychology of the market, and that past price movements can provide insights into future price movements.
One of the key tools that technical analysts use to identify congestion points is the use of charts.
Congestion points are typically found in areas of price consolidation, where the asset has remained within a narrow price range for an extended period of time.
There are several different types of congestion points that technical analysts look for. The most common type is a trading range or consolidation pattern.
This occurs when the price of an asset remains within a specific price range for an extended period of time. Traders will often look for a breakout from this trading range to identify potential trading opportunities.
Another type of congestion point is a resistance level. A resistance level is an area where the price of an asset has previously struggled to break through.
This could be due to a number of factors, such as investor sentiment, fundamental factors, or technical factors.
Resistance levels are important because they provide traders with an area to set a stop-loss order to protect against potential losses.
Support levels are another type of congestion point that traders use. Support levels are areas where the price of an asset has previously found buyers who have prevented the price from falling further.
This could be due to a number of factors, such as investor sentiment, fundamental factors, or technical factors. Like resistance levels, support levels are important because they provide traders with an area to set a stop-loss order to protect against potential losses.
Overall, congestion points are an important tool for technical analysts to identify potential trading opportunities and to help manage risk.
By understanding the different types of congestion points and how they are used, traders can better navigate the markets and make more informed trading decisions.